Requirement
Write a python code to perform Linear regression on the data given below. You are expected to build multiple models linear, quadratic, and polynomial if ncessary. (note: you don't need to do validation. please use the whole data to generate the models)
What model you will use for future predictions?
Plot the dataset (original) with the regression lines in each case ( 2 and 4 degree)
# Data:
X= [-1.32121078, -1.27082308, -1.11452161, -1.04155518, -1.03126926,
       -0.82267942, -0.81628314, -0.74574417, -0.68058031, -0.59648737,
       -0.53814101, -0.52397821, -0.46531586, -0.33476872,  0.03883677,
        0.06342208,  0.21645035,  0.26292124,  0.33366168,  0.38973193,
        0.48351149,  0.51185123,  0.55083756,  0.63525052,  0.78218406,
        0.82465693,  1.18387266,  1.27117063,  1.40967043,  1.59230389]

y = [12.00737573,  7.71098446,  4.38800339,  3.95618952,  3.2581645 ,
        5.47377341,  4.28830445,  4.3972834 ,  3.7360889 ,  3.1610471 ,
        3.15464497,  2.36058095,  4.6522462 ,  6.24929994,  5.59728231,
        7.53161638,  5.89954734,  5.86768377,  7.79154763,  6.82300825,
        6.87894839,  9.19437213,  6.75357884,  7.78934968,  9.77892827,
        8.37547998, 15.3373295 , 16.22611907, 26.3397566 , 53.34370424]

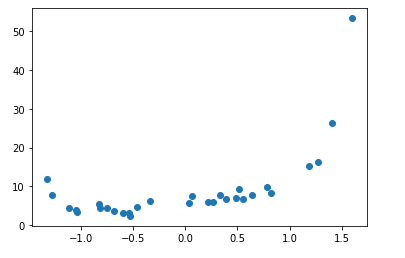
# show a scatter plot of the data
plt.scatter(X, y)
plt.show()
Output:

# |Start you code here ( you can use multiple cells)
X = np.array(X)
y = np.array(y)
X = X[:, np.newaxis]
y = y[:, np.newaxis]
import numpy as np
import matplotlib.pyplot as plt
from sklearn.linear_model import LinearRegression
model = LinearRegression()
model.fit(X, y)
y_pred = model.predict(X)
rmse = np.sqrt(mean_squared_error(y,y_pred))
r2 = r2_score(y,y_pred)
print(rmse)
print(r2)
Output:
7.499303641920036 0.3804956217183274
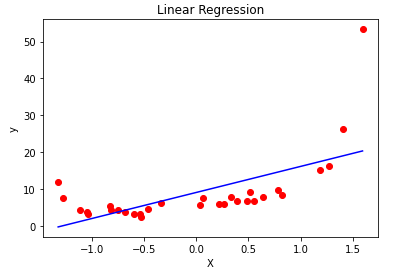
plt.scatter(X, y, color = 'red')
plt.plot(X, y_pred, color = 'blue')
plt.title('Linear Regression')
plt.xlabel('X')
plt.ylabel('y')

plt.show()
Output:

import numpy as np
import matplotlib.pyplot as plt

from sklearn.linear_model import LinearRegression
from sklearn.metrics import mean_squared_error, r2_score
from sklearn.preprocessing import PolynomialFeatures
# Visualising the Polynomial Regression results
#Degree 2
polynomial_features= PolynomialFeatures(degree=2)
x_poly = polynomial_features.fit_transform(X)
model = LinearRegression()
model.fit(x_poly, y)
y_poly_pred = model.predict(x_poly)
rmse = np.sqrt(mean_squared_error(y,y_poly_pred))
r2 = r2_score(y,y_poly_pred)
print(rmse)
print(r2)output:
4.515235029553905 0.7754240599337205
import operator
plt.scatter(X, y, s=10)
# sort the values of x before line plot
sort_axis = operator.itemgetter(0)
sorted_zip = sorted(zip(X,y_poly_pred), key=sort_axis)
X, y_poly_pred = zip(*sorted_zip)
plt.plot(X, y_poly_pred, color='m')
plt.title('Degree-2')
plt.xlabel('X')
plt.ylabel('y')

plt.show()
plt.show()
Output:

# Degree 4
polynomial_features= PolynomialFeatures(degree=4)
x_poly = polynomial_features.fit_transform(X)

model = LinearRegression()
model.fit(x_poly, y)
y_poly_pred = model.predict(x_poly)

rmse = np.sqrt(mean_squared_error(y,y_poly_pred))
r2 = r2_score(y,y_poly_pred)
print(rmse)
print(r2)
Output:
1.8082575936190255 0.9639817093208918
import operator
plt.scatter(X, y, s=10)
# sort the values of x before line plot
sort_axis = operator.itemgetter(0)
sorted_zip = sorted(zip(X,y_poly_pred), key=sort_axis)
X, y_poly_pred = zip(*sorted_zip)
plt.plot(X, y_poly_pred, color='m')
plt.title('Degree-4')
plt.xlabel('X')
plt.ylabel('y')

plt.show()
plt.show()
Output:

It's Better to choose Degree-2 because of
Correct fit
Low Bias
Whereas Degree-4 might lead to over fitting for unseen data,and simple linear regression displays underfitting ,it's optimal to choose degree-2.
Comments