
Load the dataset house.csv in R with the command:
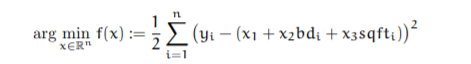
df = read.csv("house.csv")This dataset is about the house prices in a region in Europe together with the square footage and number of bedroom information denoted by the column (variable) names sqft and bd respectively. There are n=10 million data points. The purpose is to apply linear regression to predict the house prices, i.e. we want to find parameters x = [x1, x2, x3]^T that minimizes the least square error.
Equation:
We will consider gradient descent and stochastic gradient descent methods to solve the regression problems.
Rewrite the objective in the form

where A is the data matrix and n is the number of data points.
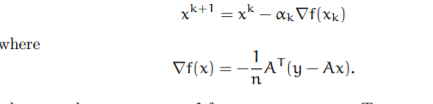
1. Implement the gradient descent(GD) method which consists of the iter- ations:
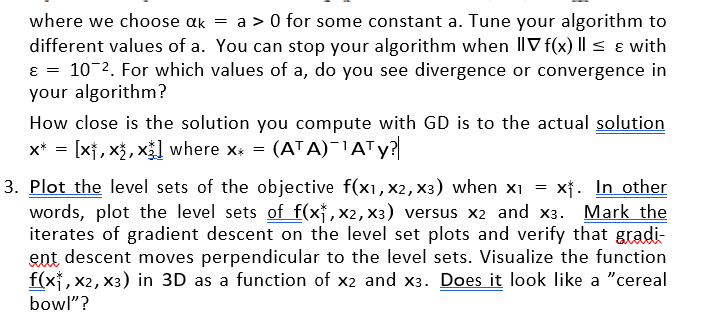
4. Repeat the previous question with different choice of the step size αk in your implementation


Repeat questions 3) and 4) for stochastic gradient descent. Can SGD be faster than GD for different values of target accuracy ε=10^−1,10^−2,10^−3,...etc? Please explain.
Sample R Code /Hint for Above Task:
# Sample code to read and normalize data
library(readr)
housing<- read_csv("C:/Users/59119/Desktop/optm_hw1/
house.csv")

## Data Normalization
df = housing#[1:1000,]
df = as.data.frame(df)
df[,1] = rep(1,nrow(df))
df[,2] = (df[,2]-mean(df[,2]))/sd(df[,2])
df[,3] = (df[,3]-mean(df[,3]))/sd(df[,3])
#df[,4] = (df[,4]-mean(df[,4]))/sd(df[,4])

## sample code for gradient descent function
gradientDesc = function(Input, learn_rate,conv_threshold,max_iter){
f_val_trend = c()
gradient_trend = c()
n = nrow(Input)
A = as.matrix(Input[,1:3])
y = as.matrix(Input[,4])
x1<-0
x2<-0
x3<-0
x = matrix(c(x1,x2,x3),nrow = 3, ncol = 1)
converged = FALSE
iter = 0
f_val = 0
while(((converged == FALSE)&(iter<max_iter))&(f_val<1e+250)){
delta_f = -t(A) %*% (y - A%*%x)
converged = norm(delta_f) <= conv_threshold
x = x - learn_rate * delta_f
yhat = A %*% x
f_val = sum((y - yhat)^2)
iter = iter + 1
f_val_trend[iter] = f_val
gradient_trend[iter] = norm(delta_f)
}
yhat = A %*% x
print("Final x parameters:")
print(x)
title = paste("learning rate a =",learn_rate)
plot(f_val_trend, main = title, type="l",xlab = "Iteration",ylab = "f(x) value")
plot(gradient_trend, type="l",main = title, xlab = "Iteration",ylab = "Norm of gradient")
cat("Final norm(gradient):",tail(gradient_trend, n=1))
cat(" Total inertations:", iter)
}

##Computing the actual result
n = nrow(df)
intercept = rep(1,n)
A = cbind(intercept,df[,2:3]) A = as.matrix(A)
y = as.matrix(df[,4])
B = solve(t(A)%*%A)
C = t(A)%*%y
best_x = B%*%C
print("Actual x parameters:") print(best_x)

#running gradient descent
gradientDesc(df, 0.000001, 0.01,100000)

#Q3 - Creating some figures / contour plots P
learn_rate = 0.01
conv_threshold = 0.1
max_iter = 500
gradient_trend = c()
x2_bd = c()
x3_sqft = c()
n = nrow(df)
A = as.matrix(df[,1:3])
y = as.matrix(df[,4])
x = matrix(c(0,0,0),nrow = 3, ncol = 1)
converged = FALSE
iter = 0
f_val = 0
while(((converged == FALSE)&(iter<max_iter))&(f_val<1e+250)){
delta_f = -t(A) %*% (y - A%*%x)
converged = norm(delta_f) <= conv_threshold
x = x - learn_rate * delta_f
yhat = A %*% x
f_val = sum((y - yhat)^2)
iter = iter + 1
gradient_trend[iter] = norm(delta_f)
x2_bd = append(x2_bd,x[2])
x3_sqft = append(x3_sqft,x[3])
}
l2 = seq(from = best_x[2]*(0.5),to = best_x[2]*(1.5), length.out = 50)
l3 = seq(from = best_x[3]*(0.5),to = best_x[3]*(1.5), length.out = 50)
x1 = rep(best_x[1],length(x2))
x2 = rep(l2,length(l2))
x3 = c()
for(i in l3){
list = rep(i,length(l3))
x3 = append(x3,list)
}
x = cbind(x1,x2,x3)
A = as.matrix(df[,1:3])
y = as.matrix(df[,4])
mse_list = c()
for(i in seq(1,length(l2)*length(l3))){
xi = as.matrix(x[i,])
yhat = A %*% xi
f_val = sum((y - yhat)^2)
mse_list[i] = f_val
}
mse_matrix = matrix(mse_list,length(l2),length(l3))
contour(l2,l3,z = mse_matrix,nlevels = 40, main = "Level sets", xlab = "X2(bd)", ylab = "X3(sqft)")
lines(x2_bd,x3_sqft,col = "red")
persp(l2,l3,mse_matrix, theta = 40,main = "3D graph", xlab = "X2(bd)", ylab = "X3(sqft)",zlab = "f(x)" )
If you need any programming assignment help in R programming, R project or R homework or need solution of above problem then we are ready to help you.
Send your request at realcode4you@gmail.com and get instant help with an affordable price.
We are always focus to delivered unique or without plagiarism code which is written by our highly educated professional which provide well structured code within your given time frame.
If you are looking other programming language help like C, C++, Java, Python, PHP, Asp.Net, NodeJs, ReactJs, etc. with the different types of databases like MySQL, MongoDB, SQL Server, Oracle, etc. then also contact us.
Comments