Computer Vision Assignment Help | Sample Practice Set- 1
- realcode4you
- Mar 5, 2022
- 7 min read
Question 1
Write a function add_gaussian_noise(im, m, std) which will add Gaussian noise with mean m and standard deviation std to the input image im and will return the noisy image. Note that the output image must be of uint8 type and the pixel values should be normalized in [0, 255].
Inputs
im is a 3 dimensional numpy array of type uint8 with values in .
m is a real number.
std is a real number.
Outputs
The expected output is a 3 dimensional numpy array of type uint8 with values in .
Data
You can work with the image at data/books.jpg .
Implementation
# Gaussian noise
def add_gaussian_noise(im, m, std):
 	# YOUR CODE HERE
 	#Converting input image to float
 	im=im.astype(float)
 	#Creating Gaussian noise with mean m and std
 	noise=np.random.normal(m,std,im.shape)
 	#Adding noise to input image
 	im=im+noise
 	#Normalizing the pixel values
 	im=im-min(im.flatten())
 	im=im/max(im.flatten())
 	im=im*255
 	#Converting it to 8 bit unsigned integer
 	im=im.astype('uint8')
 	#Returning the noisy image
 	return im
Question 2
Speckle noise is defined as multiplicative noise, having a granular pattern, it is the inherent property of Synthetic Aperture Radar (SAR) imagery. More details on Speckle noise can be found here (https://en.wikipedia.org/wiki/Speckle_(interference)). Write a function add_speckle_noise(im, m, std) which will add Speckle noise with mean m and standard deviation std to the input image im and will return the noisy image. Note that the output image must be of uint8 type and the pixel values should be normalized in .
Inputs
im is a 3 dimensional numpy array of type uint8 with values in [0, 255]
m is a real number.
std is a real number.
Outputs
The expected output is a 3 dimensional numpy array of type uint8 with values in .
Data
You can work with the image at data/books.jpg
Implementation
# Speckle noise
def add_speckle_noise(im, m, std):
  #the image has RGB channels, so we add the noise to each
  channel separately
   noisy_image = np.zeros(im.shape, np.uint8)
   noisy_image[:,:,0] = im[:,:,0] + np.random.normal(m, std, im.shape[:2])
   noisy_image[:,:,1] = im[:,:,1] + np.random.normal(m, std, im.shape[:2])
   noisy_image[:,:,2] = im[:,:,2] + np.random.normal(m, std, im.shape[:2])
   #normalize the pixel values to [0,255]
   cv2.normalize(noisy_image, noisy_image, 0, 255,
   cv2.NORM_MINMAX,   dtype=-1)
  return noisy_image
Question 3
Write a function cal_image_hist(gr_im) which will calculate the histogram of pixel intensities of a gray image gr_im . Note that the histogram will be a one dimensional array whose length must be equal to the maximum intensity value of gr_im .
Inputs
gr_im is a 2 dimensional numpy array of type uint8 with values in [0, 255].
Outputs
The expected output is a 1 dimensional numpy array of type uint8 .
Data
You can play with the image at data/books.jpg .
Implementation
# Image histogram
def cal_image_hist(gr_im):
 	hist = np.zeros(256, dtype=np.uint8)
 	for i in range(gr_im.shape[0]):
 		for j in range(gr_im.shape[1]):
 			hist[gr_im[i, j]] += 1
 	return hist
 	#raise NotImplementedError()
Question 4
Write a function compute_gradient_magnitude(gr_im, kx, ky) to compute gradient magnitude of the gray image gr_im with the horizontal kernel kx and vertical kernel ky .
Inputs
gr_im is a 2 dimensional numpy array of data type uint8 with values in .
kx and ky are 2 dimensional numpy arrays of data type uint8 .
Outputs
The expected output is a 2 dimensional numpy array of the same shape as of gr_im and of data type float64 .
Data
You can work with the image at data/shapes.png
Implementation
# Image gradient magnitude
import numpy as np
kx = np.array(([-1, 0, 1], [-2, 0, 2], [-1, 0, 1]), dtype="uint8")
# construct the Sobel y-axis kernel
ky = np.array(([-1, -2, -1], [0, 0, 0], [1, 2, 1]), dtype="uint8")
# convolution
def compute_gradient_magnitude(gr_im, kx, ky):
 	#Ix = cv2.filter2D(gr_im, -1, kx, dtype=np.float)
 	#Iy = cv2.filter2D(gr_im, -1, ky, dtype=np.float)
 	Ix = cv2.filter2D(gr_im, -1, kx)
 	Iy = cv2.filter2D(gr_im, -1, ky)
 	g = np.sqrt((Ix**2 + Iy**2), dtype=np.float)
 	return g
Question 5
Write a function compute_gradient_direction(gr_im, kx, ky) to compute direction of gradient of the gray image gr_im with the horizontal kernel kx and vertical kernel ky .
Inputs
gr_im is a 2 dimensional numpy array of data type uint8 with values in .
kx and ky are 2 dimensional numpy arrays of data type uint8 .
Outputs
The expected output is a 2 dimensional numpy array of same shape as of gr_im and of data type float64 .
Data
You can work with the image at data/shapes.png .
Implementation
def compute_gradient_direction(gr_im, kx, ky):
	#enter code here
	raise NotImplementedError()
Question 6
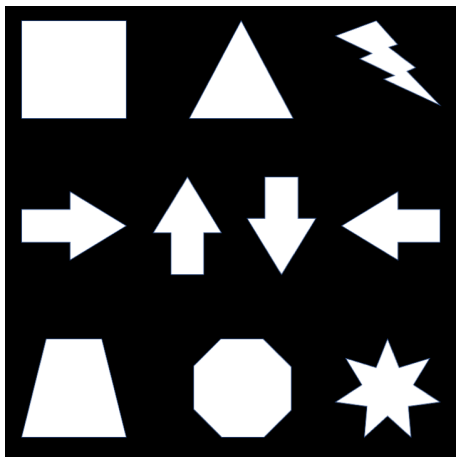
Write a function detect_harris_corner(im, ksize, sigmaX, sigmaY, k) which will detect the corners in the image im . Here ksize is the kernel size for smoothing the image, sigmaX and sigmaY are respectively the standard deviation of the kernal along the horizontal and vertical direction, and k is the constant in the Harris criteria. Experiment with your corner detection function on the following image (located at data/shapes.png ):

Adjust the parameters of your function so that it can detect all the corners in that image. Please feel free to change the given default parameters and set your best parameters as default. You must not resize the above image and note that the returned output should be an N*2 array of type int64 , where N is the total number of existing corner points in the image; each row of that N*2 array should be a Cartesian coordinate of the form(x, y) . Also please make sure that your function is rotation invariant which is the fundamental property of the Harris corner detection algorithm.
Inputs
im is a 3 dimensional numpy array of type uint8 with values in .
ksize is an integer number.
sigmaX is an integer number. sigmaY is an integer number.
k is a floating number.
Outputs
The expected output is 2 dimension numpy array of data type int64 of size N*2 , whose each row should be a Cartesian coordinate of the form(x, y) .
Data
You can work with the image at data/shapes.png .
# Harris corner detection
def detect_harris_corner(im, ksize=5, sigmaX=3, sigmaY=3, k=0.01):
 # YOUR CODE HERE
 #the image contains RGB channels
 #we only need one channel
 im = im[:,:,0]
 #smooth the image
 im = cv2.GaussianBlur(im, (ksize, ksize), sigmaX, sigmaY)
 #compute the gradients
 Ix = cv2.Sobel(im, cv2.CV_64F, 1, 0, ksize=5)
 Iy = cv2.Sobel(im, cv2.CV_64F, 0, 1, ksize=5)
 #compute the products of the gradients
 IxIx = Ix * Ix
 IyIy = Iy * Iy
 IxIy = Ix * Iy
 #compute the sum of the products of the gradients
 IxIx = cv2.GaussianBlur(IxIx, (ksize, ksize), sigmaX, sigmaY)
 IyIy = cv2.GaussianBlur(IyIy, (ksize, ksize), sigmaX, sigmaY)
 IxIy = cv2.GaussianBlur(IxIy, (ksize, ksize), sigmaX, sigmaY)
 #compute the cornerness
 det = IxIx * IyIy - IxIy * IxIy
 trace = IxIx + IyIy
 R = det - k * trace * trace
 #find the local maxima
 corners = np.argwhere(R > 0)
 #return the coordinates of the corners
 return corners
 #raise NotImplementedError()
Question 7
Write a function compute_homogeneous_rotation_matrix(points, theta) to compute the rotation matrix in homogeneous coordinate system to rotate a shape depicted with 2 dimensional(x, y) coordinates points to an angle theta ( theta in the definition) in the anticlockwise direction about the center of the shape.
Inputs
points is a 2 dimensional numpy array of data type uint8 with shape . Each row of points is a Cartesian coordinate . theta is a floating point number denoting the angle of rotation in degree.
Outputs
The expected output is a 2 dimensional numpy array of data type float64 with shape 3*3 .
Data
You can work with the 2 dimentional numpy array at data/points.npy .
# Homogeneous rotation matrix
def compute_homogeneous_rotation_matrix(points, theta):
 	theta = np.deg2rad(theta)
 	rotation_matrix = np.array([[np.cos(theta), -np.sin(theta), 0],
	[np.sin(theta), np.cos(theta), 0], [
 return rotation_matrix
 #raise NotImplementedError()
Question 8
Write a function compute_sift(im, x, y, feature_width) to compute a basic version of SIFT-like local features at the locations (x, y) of the RGB image im as described in the lecture materials and chapter 7.1.2 of the 2nd edition of Szeliski's book. The parameter feature_width is an integer representing the local feature width in pixels. You can assume that feature_width will be a multiple of 4 (i.e. every cell of your local SIFT-like feature will have an integer width and height). This is the initial window size you examine around each keypoint. Your implemented function should return a numpy array of shape k*128 , where is the number of keypoints(x,y) input to the function.

Please feel free to follow all the minute details of the SIFT paper (https://www.cs.ubc.ca/~lowe/papers/ijcv04.pdf) in your implementation, but please note that your implementation does not need to exactly match all the details to achieve a good performance. Instead a basic version of SIFT implementation is asked in this exercise, which should achieve a reasonable result. The following three steps could be considered as the basic steps: (1) a 4*4 grid of cells, each feature_width/4. It is simply the terminology used in the feature literature to describe the spatial bins where gradient distributions will be described. (2) each cell should have a histogram of the local distribution of gradients in orientations. Appending these histograms together will give you 4*4*8= 128 dimensions. (3) Each feature should be normalized to unit length.
Inputs
im is a 3 dimensional numpy array of data type uint8 with values in .
x is a 2 dimensional numpy array of data type float64 with shape .
y is a 2 dimensional numpy array of data type float64 with shape .
feature_width is an integer.
Outputs
The expected output is a 2 dimensional numpy array of data type float64 with shape k*d , where d= 128 is the length of SIFT feature vector.
Data
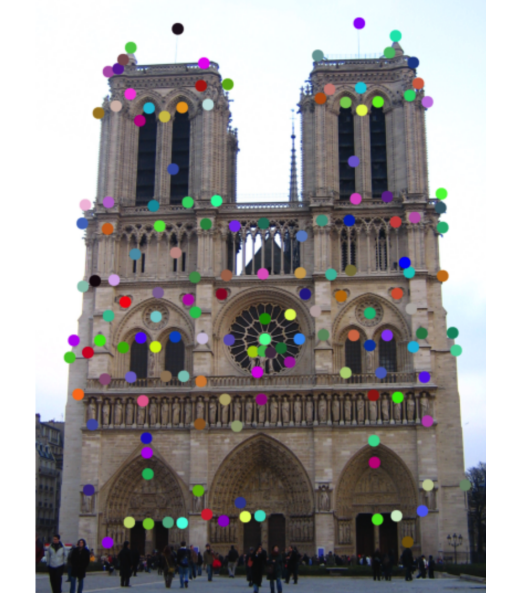
You can tune your algorithm/parameters with the image at data/notre_dame_1.jpg and interest points at data/notre_dame_1_to_notre_dame_2.pkl .
Implementation
# SIFT like features
def compute_sift(im, x, y, feature_width=16, scales=None):
 # YOUR CODE HERE
 # Convert image to grayscale if it's not already
 if len(im.shape) == 3:
 im = cv2.cvtColor(im, cv2.COLOR_BGR2GRAY)
 # Compute x,y gradients
 gx = cv2.Sobel(im, cv2.CV_64F, 1, 0, ksize=1)
 gy = cv2.Sobel(im, cv2.CV_64F, 0, 1, ksize=1)
 # Compute magnitudes and orientations
 mag, ori = cv2.cartToPolar(gx, gy, angleInDegrees=True)
 # Generate feature vector for each interest point
 features = []
 for i in range(x.shape[0]):
 # Extract 4x4 grid around interest point
 x_start = int(x[i] - feature_width / 2)
 x_end = int(x[i] + feature_width / 2)
 y_start = int(y[i] - feature_width / 2)
 y_end = int(y[i] + feature_width / 2)
 # Extract 4x4 grid around interest point
 mag_patch = mag[y_start:y_end, x_start:x_end]
 ori_patch = ori[y_start:y_end, x_start:x_end]
 # Compute histogram of gradients for each cell
 hist = np.zeros((4, 4, 8))
 for j in range(4):
 for k in range(4):
 # Compute histogram for each cell
 hist[j, k], _ = np.histogram(ori_patch[j, k], bins=8, range=(0, 360), weights=mag_patch[
 # Normalize histogram
 hist = hist / np.linalg.norm(hist)
 # Append feature vector to list of features
 features.append(hist.flatten())
 return np.array(features)
 #raise NotImplementedError()
If you have any query or need any project or assignment help in computer vision then share your request at:
realcode4you@gmail.com
Comments